Run the Practice Statistical Analysis report to obtain a report and accompanying charts and graphs that provide you with valuable insights to help your practice identify trends in business and patient care. The report compiles data on a monthly basis, and can be generated for any range of dates.
Watch video tutorial. (Windows Media Player, an active Internet connection, and a valid Ortho2 customer login are required to run video tutorials, webinars, and training programs.)
Several ViewPoint settings and processes must be maintained in order for the Practice Statistical Analysis report to generate accurate data.
Assign procedure statistics classifications - The appointment data in this report is compiled using the Statistics Classification settings in your Procedure table. For the report data to be accurate, you must assign each procedure in your Procedure table to an appropriate classification. See "Set Up Procedure List" for details.

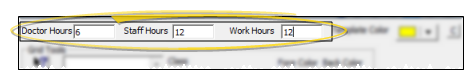
Assign work hours - The work hours in the Practice Statistical Analysis report are compiled from the Doctor Hours, Staff Hours, and Work Hours settings in your Grid Scheduler templates. ViewPoint determines which templates were assigned to each day of the month, then calculates the sum of the work hours from each template. (See "Use Template Editing Tools" for details about setting up work hours in your templates.)
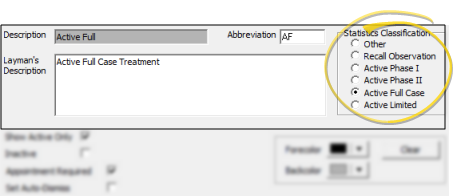
Assign status statistics classifications - The patient data analysis in this report is compiled using the Statistics Classification settings in your Status table. For the report data to be accurate, you must assign each status description that you want to be tracked to the appropriate classification. (Status descriptions without a classification will be ignored.) See "Set Up Status List" for details.
Process appointments - At a minimum, you must process appointments as Kept or Missed for the appointment data in this report to be compiled accurately. See "Process Appointments" for details.
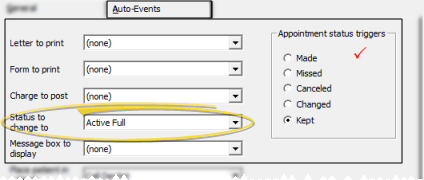
Maintain patient status integrity - To obtain accurate patient data analysis, you must assign a different status to the patient folder each time the patient enters a new type of treatment.
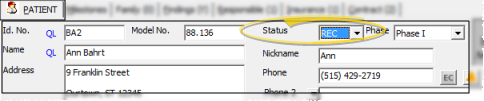
You might want to use Auto-Events to automatically trigger status changes whenever certain appointment procedures are scheduled or kept. See "Set Up Procedure List" for details.
Run final Transaction report regularly - Only charge and receipt transactions that have been included in a final Transaction report are included in the Practice Statistical Analysis report calculations. Note that the transaction dates that appear on the Practice Statistical Analysis report are the dates of the final Transaction reports the transaction reports appear on. Usually, the final Transaction report date and the charge or receipt posting date are the same, but be aware that if you post transactions after generating a final Transaction report for the day, those transactions will not be included in the Practice Statistical Analysis until another final Transaction report is generated, and, the date of those transactions will be the next final Transaction report date. See "Transaction Report" for details.
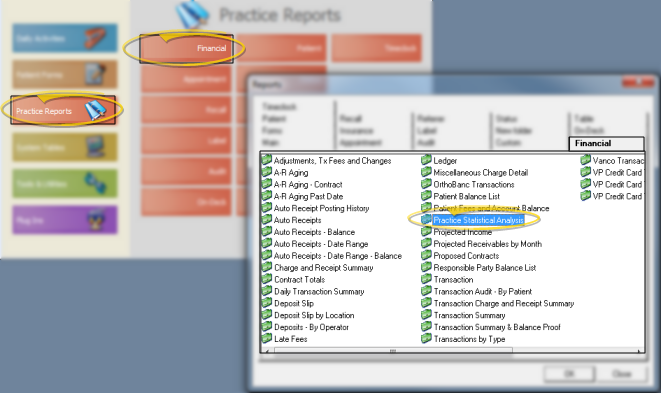
ViewPoint main menu > Practice Reports > Financial >Practice Statistical Analysis.
Date - Choose the date or dates to use. You can type a date in the Date field, or click the v button to select a date from a calendar.
Office - Choose to include only the records for a specific office, or include the records for all office locations in your practice.
Orthodontist - Choose to include only the records for a specific orthodontist, or include the records for All orthodontists in your practice.
Manage Record Selections & Output - After selecting the report options, click Ok to continue to your output choices. See "Manage Record Selection & Output" for details.
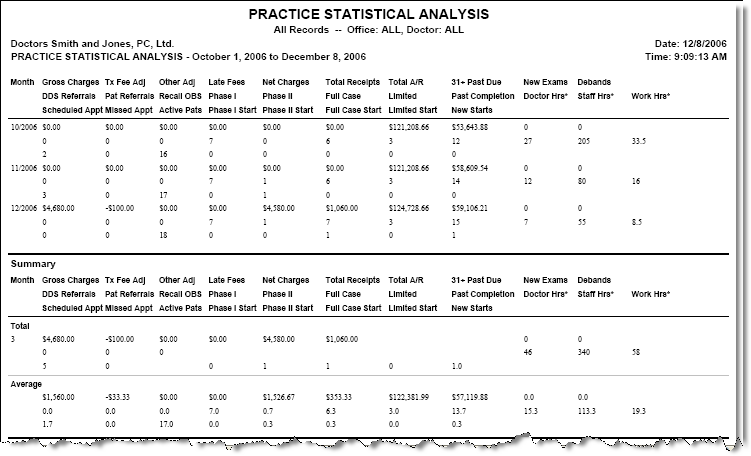
The report fields are "stacked" three per column, and separated by month. The summary at the bottom of the report provides both a total amount, and an average amount of each field for the range of months included in the report.
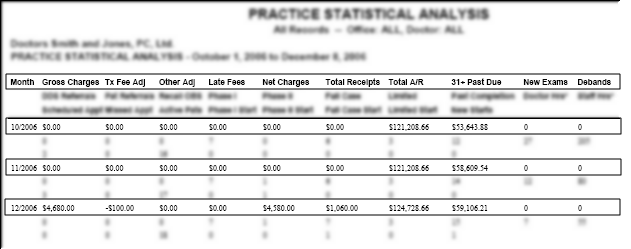
Gross Charges - Miscellaneous charges plus Treatment Fee (or Contract) charges posted within the date range.
Tx Fee Adj (Treatment Fee Adjustments) - Contract adjustments posted within the date range.
Other Adj (Other Adjustments) - Miscellaneous charge adjustments due within the date range.
Late Fees - Late fees posted within the date range.
Net Charges - The sum of Gross Charges + Tx Fee Adj + Other Adj + Late Fees.
Total Receipts - Receipt transactions posted within the date range.
Total AR (Total Accounts Receivable) - The difference between charges (including miscellaneous charges and contract charges that were unpaid at that time) and receipts posted within that month.
31+ Past Due - The amount of money that is 31 or more days past due, including miscellaneous charges and contract charges that have fallen past due.
New Exams - Appointments with the procedure statistics classification of "Exam" that were processed as kept during the date range.
Debands - Appointments with the procedure statistics classification of "Deband" that were processed as kept during the date range.
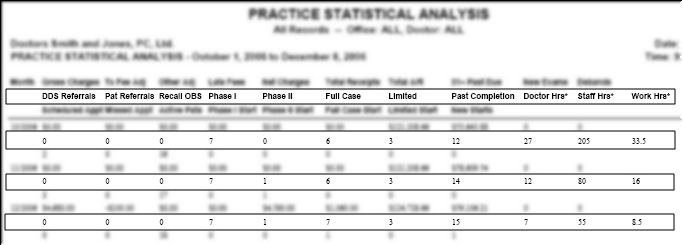
DDS Referrals - The number of New Exams![]() that were referred
to you by a dentist. (Use the link in your Referral table to indicate referral sources that are also dentists. See "Set Up Referrer List" for details).
that were referred
to you by a dentist. (Use the link in your Referral table to indicate referral sources that are also dentists. See "Set Up Referrer List" for details).
Pat Referrals (Patient Referrals) - The number of New Exams![]() that were referred
to you by a patient in your office. (Use the link in your Referral table to indicate referral sources that are also patients. See "Set Up Referrer List" for details).
that were referred
to you by a patient in your office. (Use the link in your Referral table to indicate referral sources that are also patients. See "Set Up Referrer List" for details).
Recall OBS (Recall / Observation) - The number of patients who, within the date range, had their status changed to a description classified as "Recall Observation" that: 1) Have never been assigned to a status flagged with any "Active" classification and 2) Have never before been assigned to a status classified as Recall Observation.
Phase I - The number of patients with a status description classified as "Active Phase I".
Phase II - The number of patients with a status description classified as "Active Phase II".
Full Case - The number of patients with a status description classified as "Active Full Case".
Limited - The number of patients with a status description classified as "Active Limited".
Past Completion - The number of patients that are deemed to have gone past their expected treatment time. Click here for details about this calculation...
Doctor Hours - The total number of hours defined as Doctor Hours by your grid templates for the month. This field reports the total hours on a whole practice basis only, even if you subgroup the report by doctor or office.
Staff Hours - The total number of hours defined as Staff Hours by your grid templates for the month. This field reports the total hours on a whole practice basis only, even if you subgroup the report by doctor or office.
Work Hours - The total number of hours defined as Work Hours by your grid templates for the month. This field reports the total hours on a whole practice basis only, even if you subgroup the report by doctor or office.
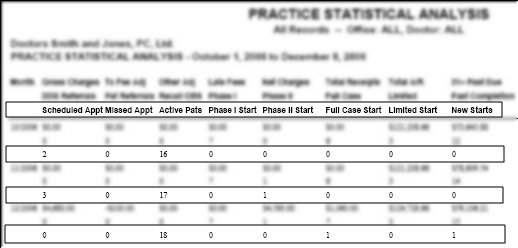
Scheduled Appt (Scheduled Appointments) - The number of appointments that were processed as Kept or Missed within the date range.
Missed Appts (Missed Appointments) - The number of appointments that were processed as Missed within the date range.
Active Pats (Active Patients) - The number of patients with any Active status classification during the date range.
Phase I Start - The number of patients who, within the date range, had their status changed to an Active Phase I classification that have never before been assigned to any Active status.
Phase II Start - The number of patients who, within the date range, had their status changed to an Active Phase II classification that have never before been assigned to any Active status.
Full Case Start - The number of patients who, within the date range, had their status changed to an Active Full Case classification that have never before been assigned to any Active status.
Limited Start - The number of patients who, within the date range, had their status changed to an Active Limited classification that have never before been assigned to any Active status.
New Starts - The number of Phase I Starts + Full Case Starts + Limited Starts. Note that Phase II Starts are not included.
The graphs and charts at the bottom of the Practice Statistical Analysis compare and contrast various report values.
Net Charges vs. Total Receipts - This graph compares your Net Charges![]() and Total Receipts
and Total Receipts![]() for each month
within the date range.
for each month
within the date range.
Total
A/R vs. 31+ Past Due - This graph compares your Total A/R![]() with the amount that is 31+ Days Past
Due
with the amount that is 31+ Days Past
Due![]() for each month within the date range.
for each month within the date range.
Total
Receipts / Scheduled Apps - This graph compares your Total Receipts![]() with the number of Scheduled Appointments
with the number of Scheduled Appointments![]() for each
month within the date range.
for each
month within the date range.
Missed
Appointment % - This graph (often called Failure Percentage) delineates the percentage
of the Scheduled Appointments![]() that were processed as Missed
that were processed as Missed![]() for each month within the date range.
for each month within the date range.
Exams
vs. New Starts - This graph compares the number of New Exams![]() with the number of New Starts
with the number of New Starts![]() for each month within the date range.
for each month within the date range.
New
Start Conversion % - This graph (often called Monthly
Conversion %) delineates the percentage of New Exams![]() to New
Starts
to New
Starts![]() for
each month within the date range.
for
each month within the date range.
Patients
Per Day - This graph calculates the daily number of Scheduled Appointments![]() , based
on an eight-hour day (determined by dividing your Work Hours
, based
on an eight-hour day (determined by dividing your Work Hours![]() for the month
into 8-hour days), for each month within the date range.
for the month
into 8-hour days), for each month within the date range.
Receipts/Hour
Doctor(s) vs.
Staff - This graph calculates hourly Total Receipts![]() for your Doctor Hours
for your Doctor Hours![]() and
Staff Hours
and
Staff Hours![]() for each month within the date range.
for each month within the date range.
31+
Past Due % - This graph delineates the percentage of your Total A/R![]() that was
31+ Days Past Due
that was
31+ Days Past Due![]() for each month within the date range.
for each month within the date range.
Net
Charges / New Starts - This graph compares your Net Charges![]() with the number of New Starts
with the number of New Starts![]() for each month within the date range.
for each month within the date range.
Past
Completion % - This graph delineates the percentage of Active Patients![]() that are considered to be Past Completion
that are considered to be Past Completion![]() for each month within the date range.
for each month within the date range.
New
Starts vs. Debands - This graph compares the number of New Starts![]() with the number of Debands
with the number of Debands![]() for each
month within the date range.
for each
month within the date range.
Phase
II Conversion % - This graph delineates the percentage of patients in Phase II![]() plus patients in Phase I
plus patients in Phase I![]() that were changed to Phase II Start
that were changed to Phase II Start![]() for each month within the date range.
for each month within the date range.
All
Active Patients - This pie chart divides your total Active Patients![]() into Phase I
into Phase I![]() , Phase II
, Phase II![]() , Full Case
, Full Case![]() and Limited
and Limited![]() categories. The
percentages are determined by averaging the values of each status for
the date range.
categories. The
percentages are determined by averaging the values of each status for
the date range.
New
Starts - This pie chart divides the total number of New Starts![]() within the date range into Phase I Start
within the date range into Phase I Start![]() , Phase II Start
, Phase II Start![]() ,
Full Case Start
,
Full Case Start![]() and Limited Start
and Limited Start![]() categories (all bottom row report values).
categories (all bottom row report values).

 │
│  │
│  │
│ 
Ortho2.com │1107 Buckeye Avenue │ Ames, Iowa 50010 │ Sales: (800) 678-4644 │ Support: (800) 346-4504 │ Contact Us
Chat with Software Support │Chat with Network Engineering │ Chat with New Customer Care
Remote Support │Email Support │ Online Help Ver. 12/18/2015


