Practice Statistical Analysis Report
Run the Practice Statistical Analysis report to obtain a report and
accompanying charts and graphs that provide you with valuable insights to help
your practice identify trends in business and patient care. The report
compiles data on a monthly basis, and can be generated for any range of
dates.
Watch the movie. (Windows Media Player, an active Internet connection, and a valid Ortho2 customer login are required to run video tutorials, webinars, and training programs.)
Several ViewPoint settings and processes must be maintained in order for the Practice Statistical Analysis report to generate accurate data.
 Procedure Statistics Classifications - The appointment data in this report is compiled using the Statistics Classification settings in your Procedure table. For the report data to be accurate, you must assign each procedure in your Procedure table to an appropriate classification. See "Appointment Procedure Table" for details.

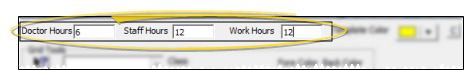
Work Hours - The work hours in the Practice Statistical Analysis report are compiled from the Doctor Hours, Staff Hours, and Work Hours settings in your Grid Scheduler templates. ViewPoint
determines which templates were assigned to each day of the month, then
calculates the sum of the work hours from each template. (See "Grid Template Tools" for details about setting up work hours in your templates.)
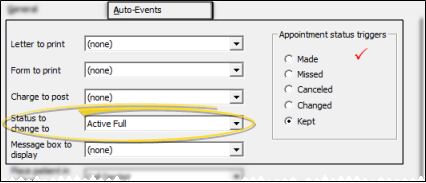
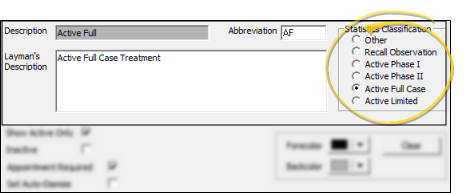
Status Statistics Classifications - The patient data analysis in this report is compiled using the Statistics Classification settings in your Status table. For the report data to be accurate, you must assign each status description that you want to be tracked to the appropriate classification. (Status descriptions without a classification will be ignored.) See "Status Table" for details.
Process Appointments - At a minimum, you must process appointments as Kept or Missed for the appointment data in this report to be compiled accurately. See "Process Appointments" for details.
Maintain Patient Status Integrity - To obtain accurate patient data analysis, you must assign a different status to the patient folder each time the patient enters a new type of treatment.
Final Transaction Report - Only charge and receipt transactions that have been included in a final Transaction report are included in the Practice Statistical
Analysis report calculations. The transaction dates that appear on the Practice Statistical Analysis report are the dates of the final
Transaction reports on which the transactions appear. Usually,
the final Transaction report date and the charge or receipt posting date are the same, but be aware that if you post transactions after generating
a final Transaction report for the day, those transactions
will not be included in the Practice Statistical Analysis until another
final Transaction report is generated, and,
the date of those transactions will be the next final Transaction
report date. See "Transaction Report" for details.
-
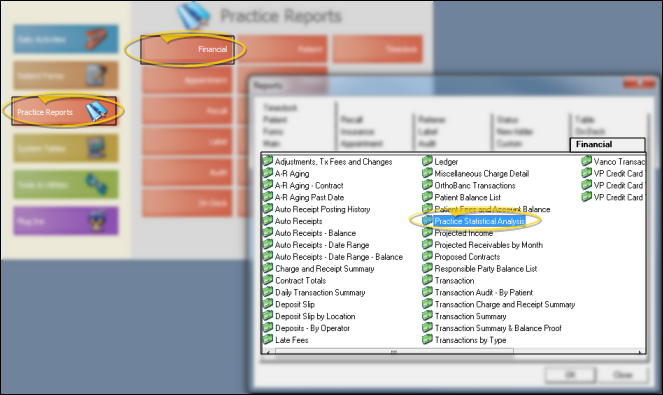
Open the Report - ViewPoint main menu > Practice Reports > Financial >Practice Statistical Analysis.
-
Choose Your Settings - Select the options to use for choosing records and generating this report. Choose carefully, as your selections will affect which patients are included in the report.
First Date / Last Date - Choose the range of dates to include on this report, or select a single date for both the First Date and Last Date fields to run the report for an individual date. You can type a date in the field, click the up / down buttons to advance the current field, or use the drop down button to select a date from a calendar. In addition, you can click the [ T ] button to select today, the [+W] button to advance the date by one week, or the [+M] button to advance one month. Also, pressing Shift or Control while you click one of the date buttons takes you backwards one week or one month instead.The date appears just under the report title; if you select a date that is not today, this date will be different from the run date that appears in the report header.
Office - Choose to include only the records for a specific office, or include the records for all office locations in your practice.
Doctor - Choose to include only the records for a specific doctor, or include the records for all doctors in your practice.
-
Output Options - After selecting the report settings, click Ok to continue to your output choices. See "Manage Record Selection & Output" for details.
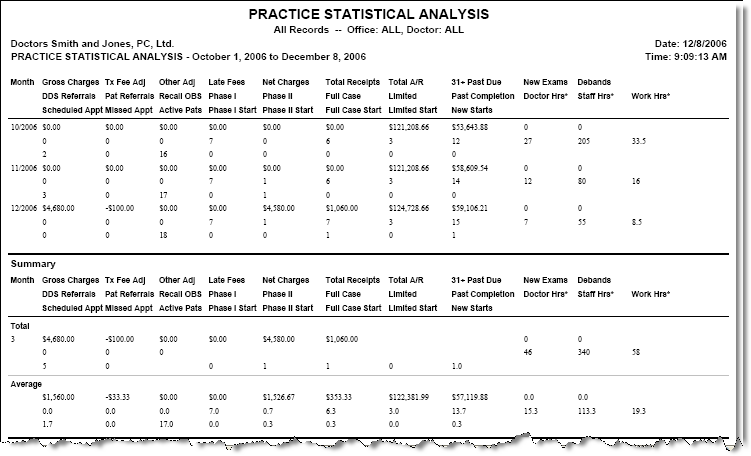
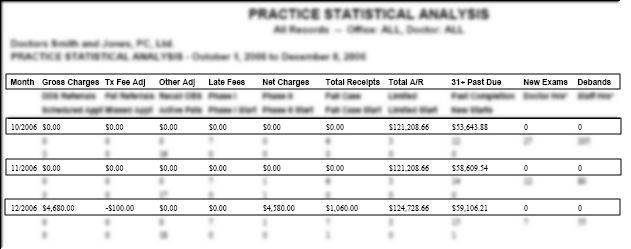
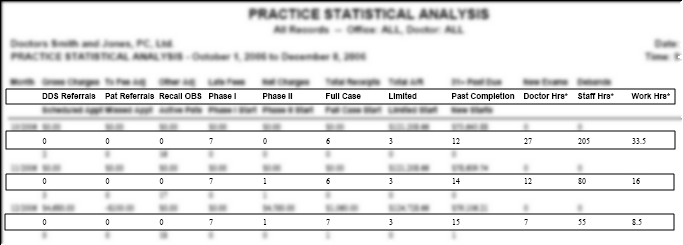
Report Definitions & Calculations
The report fields are "stacked"
three per column, and separated by month. The summary at the bottom of
the report provides both a total amount, and an average amount of each
field for the range of months included in the report.
Top Row Definitions & Calculations
Gross Charges - Miscellaneous charges
plus Treatment Fee (or Contract) charges posted within
the date range.
Tx Fee Adj - (Treatment Fee Adjustments) Contract adjustments posted within the date range. (See "Adjust & Reallocate Contracts" for details about contract adjustments.)
Other Adj - (Other Adjustments) Miscellaneous charge adjustments due within the date
range. (See "Post Non-Production Charge Adjustments" for details about miscellaneous charge adjustments.)
Late Fees - Late fees posted within the date range. (See "Print and Post Late Fees" for details about posting late fees.)
Net Charges - The sum of Gross Charges
+ Tx Fee Adj
+ Other Adj
+ Late Fees.
Total Receipts - Receipt transactions posted within the date range.
Total AR - (Total Accounts Receivable) The difference between charges (including miscellaneous charges and contract charges that were
unpaid at that time) and receipts posted within that month.
31+ Past Due - The amount of money that is 31 or more days past
due, including miscellaneous charges and contract charges that have fallen past due.
New Exams - Appointments with the procedure statistics classification of "Exam" that were processed as kept during the date range.
Debands - Appointments with the procedure statistics classification (described above) of "Deband" that were processed as kept during the date range.
Middle Row Definitions & Calculations
DDS Referrals - The number of that were referred
to you by a dentist. (Use the link in your Referral table to indicate referral sources that are also dentists. See "Referrer Records" for details.)
Pat Referrals - (Patient Referrals) The number of that were referred
to you by a patient in your office. (Use the link in your Referral table to indicate referral sources that are also patients. See "Referrer Records" for details.)
Recall OBS - (Recall / Observation) The number of patients who, within the date range, had their status
changed to a description as "Recall Observation" that: 1) Have never been assigned
to a status flagged with any "Active" classification and 2) Have never before been assigned to a status classified as Recall
Observation.
Phase I - The number of patients with a status description as "Active Phase I" during the date range.
Phase II - The number of patients with a status description as "Active Phase II" during the date range.
Full Case - The number of patients with a status description as "Active Full Case" during the date range.
Limited - The number of patients with a status description as "Active Limited" during the date range.
Past Completion - The number of patients who have gone past their estimated treatment time.
Past Completion Calculations - The Practice Statistical Analysis report, the Past Completion report, and the Exceeds Length of Treatment report all look for patients that are deemed to have gone past their expected treatment time. However, the reports use slightly different methods to determine which patients should be included. So, the patients included can be
different depending on which report you run.
In the Practice Statistical Analysis report and the Past Completion report, ViewPoint looks at all of a patient's treatment phases for an expected appliance removal date within the selected date range, but who either do not have an actual appliance removal date at all for that phase, or have a removal date that is after the expected appliance removal date. (You
can find these dates on the Findings tab of the patient folder.)
However, the Exceeds Length of Treatment report looks only at the patient's current treatment phase for the missing or past actual appliance removal date.
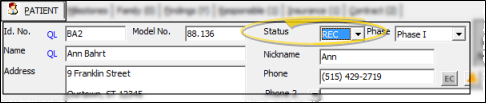
For example, let's say you have a patient, "Ann", whose current treatment phase is
Active Full Treatment. Ann has
several months to go before she reaches the expected appliance removal date for this phase, so she is not included on your Exceeds Length of
Treatment report. However, if you look back at Ann's Pre-Treatment phase, you would see that the actual appliance removal date has not been entered, and the expected appliance removal date is in the past. So, the Practice Statistical Analysis and Past Completion reports count Ann as past treatment time.
This discrepancy
in the report calculations should alert you to inconsistent data, and help you make the appropriate corrections.
Doctor Hours - The total number of for the month that were defined as Doctor Hours. This field reports the total hours
on a whole practice basis only,
even if you subgroup the report by doctor or office.
Staff Hours - The total number of for the month that were defined as Staff Hours. This field reports the total hours
on a whole practice basis only,
even if you subgroup the report by doctor or office.
Work Hours - The total number of for the month that were defined as Work Hours. This field reports the total hours
on a whole practice basis only,
even if you subgroup the report by doctor or office.
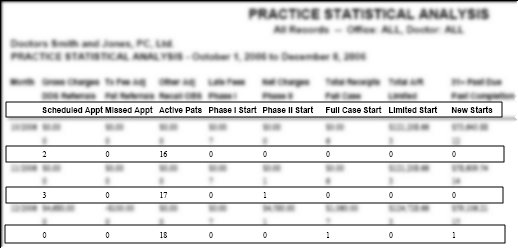
Bottom Row Definitions & Calculations
Scheduled Appt - (Scheduled Appointments) The number
of appointments that were processed as Kept or Missed within the date range.
Missed Appts - (Missed Appointments) The number
of appointments that were processed as Missed within the
date range.
Active Pats - (Active Patients) The number of patients with a status description as any "Active" status during the date range.
Phase I Start - The number of patients who, within the date range, had their status
changed to an "Active Phase I" that have never before been assigned
to any "Active" status.
Phase II Start - The number of patients who, within the date range, had their status
changed to an "Active Phase II" , regardless of any prior status classification.
Full Case Start - The number of patients who, within the date range, had their status
changed to an "Active Full Case" that have never before been assigned
to any "Active" status.
Limited Start - The number of patients who, within the date range, had their status
changed to an "Active Limited" that have never before been assigned
to any "Active" status.
New Starts - The number of Phase I Starts
+ Full Case Starts + Limited Starts: Phase II Starts are not
included.
Graphs & Charts
Net Charges vs. Total Receipts - This graph compares your and for each month
within the date range.
Total
A/R vs. 31+ Past Due - This graph compares your with the amount that is for each month within the date range.
Total
Receipts / Scheduled Apps - This graph compares your with the number of for each
month within the date range.
Missed
Appointment % - This graph (often called Failure Percentage) delineates the percentage
of the that were processed as "Missed" for each month within the date range.
Exams
vs. New Starts - This graph compares the number of with the number of for each month within the date range.
New
Start Conversion % - This graph (often called Monthly
Conversion %) delineates the percentage of to for
each month within the date range.
Patients
Per Day - This graph calculates the daily number of , based
on an eight-hour day (determined by dividing your for the month
into 8-hour days), for each month within the date range.
Receipts / Hour
Doctor(s) vs.
Staff - This graph calculates hourly for your and
for each month within the date range.
31+
Past Due % - This graph delineates the percentage of your that was
for each month within the date range.
Net
Charges / New Starts - This graph compares your with the number of for each month within the date range.
Past
Completion % - This graph delineates the percentage of that are considered to be Past Completion for each month within the date range.
Past Completion Calculations - The Practice Statistical Analysis report, the Past Completion report, and the Exceeds Length of Treatment report all look for patients that are deemed to have gone past their expected treatment time. However, the reports use slightly different methods to determine which patients should be included. So, the patients included can be
different depending on which report you run.
In the Practice Statistical Analysis report and the Past Completion report, ViewPoint looks at all of a patient's treatment phases for an expected appliance removal date within the selected date range, but who either do not have an actual appliance removal date at all for that phase, or have a removal date that is after the expected appliance removal date. (You
can find these dates on the Findings tab of the patient folder.)
However, the Exceeds Length of Treatment report looks only at the patient's current treatment phase for the missing or past actual appliance removal date.
For example, let's say you have a patient, "Ann", whose current treatment phase is
Active Full Treatment. Ann has
several months to go before she reaches the expected appliance removal date for this phase, so she is not included on your Exceeds Length of
Treatment report. However, if you look back at Ann's Pre-Treatment phase, you would see that the actual appliance removal date has not been entered, and the expected appliance removal date is in the past. So, the Practice Statistical Analysis and Past Completion reports count Ann as past treatment time.
This discrepancy
in the report calculations should alert you to inconsistent data, and help you make the appropriate corrections.
New
Starts vs. Debands - This graph compares the number of with the number of for each
month within the date range.
Phase
II Conversion % - This graph delineates the percentage of patients in plus patients in that were changed to for each month within the date range.
All
Active Patients - This pie chart divides your total into , , , and categories. The
percentages are determined by averaging the values of each status for
the date range.
New
Starts - This pie chart divides the total number of within the date range into , ,
, and categories (all bottom row report values).