Analysis Options
Your SmartCeph Analysis Options determine the analysis to use for your ceph tracings, including any additional structures you want to plot. In addition, you use this window to set up the path for any custom analysis you have, and choose whether to include a graphic on your printed Analysis Reports.
SmartCeph analysis calculations are based on measuring landmark-to-landmark distances and plane-to-plane angles. The SmartCeph software is tested to verify the accuracy of these methods, whether you use a millimeter scale or device DPI calibration.
The verification tests use an image of an object of a known size (a metric ruler), an expected distance between two landmarks of 100mm, and a protractor illustrating a 45-degree angle. The results of these verification tests are expressed below, though it is important to remember that the greatest sources of variation come from placement of the points, or structures, by a user and from correct calibration. (See "Calibration" for details about performing accurate calibration.)
mm Calibration Verification Test Results
| Measurement
|
Mean
|
SD
|
| Expected length 100 mm |
99.6 |
0.6 |
| Expected angle 45 degrees |
45.1 |
0.1 |
DPI Calibration Verification Test Results
| Measurement
|
Mean
|
SD
|
| Expected length 100 mm |
99.9 |
0.2 |
| Expected angle 45 degrees |
44.9 |
0.2 |
SmartCeph provides predefined analysis that have been carefully crafted from standard industry sources and have been tested for accuracy. In addition to the standard analysis choices built into SmartCeph, you can use the Custom Analysis feature to create your own analysis templates, or Ortho2 can, at your request, provide you a custom analysis for a fee. A custom analysis can include landmarks, planes, or variables from standard SmartCeph analyses, or your own alternate sources. In the case of custom analyses, the customer verifies the accuracy of the implementation of the analysis.
ABO - This analysis is used by the American Board of Orthodontics for clinical testing to evaluate a doctor for board certification. The main content of the analysis was gathered from the ABO website. The norms and standard deviations use values from An Atlas of Craniofacial Growth: Cephalometric Standards from the University School Growth Study . Riolo ML, Moyers RE, McNamara JA Jr., Hunter WS. An Atlas of Craniofacial Growth: Cephalometric Standards From the University School Growth Study, The University of Michigan. Ann Arbor, MI: Center for Human Growth and Development, University of Michigan. 1974.
Alabama - The source for this analysis is from the "American Journal of Orthodontics", Volume 52, Issue 4, April 1966. The norms and standard deviations use values from An Atlas of Craniofacial Growth: Cephalometric Standards from the University School Growth Study . (Riolo et al, 1974).
Downs - The source for this analysis, as well as norms and standard deviations values, are from An Atlas of Craniofacial Growth: Cephalometric Standards from the University School Growth Study , pages 335-340. (Riolo et al, 1974).
McLaughlin - The source for this analysis, as well as norms and standard deviations values, are from Dr. McLaughlin's office via email correspondence with Ortho2, 2011.
McNamara - The source for this analysis, as well as norms and standard deviations values, are from the "American Journal of Orthodontics", Volume 86, Issue 6, December 1984.
Ricketts - The source for this analysis, as well as norms and standard deviations values, are from An Atlas of Craniofacial Growth: Cephalometric Standards from the University School Growth Study , pages 348-351. (Riolo et al, 1974).
Steiner - The source for this analysis, as well as norms and standard deviations values, are from An Atlas of Craniofacial Growth: Cephalometric Standards from the University School Growth Study , pages 341-347. (Riolo et al, 1974).
Tweed - The source for this analysis, as well as norms and standard deviations values, are from An Atlas of Craniofacial Growth: Cephalometric Standards from the University School Growth Study , pages 352-354. (Riolo et al, 1974).
WITS - The source for this analysis, as well as norms and standard deviations values, are from "Radiographic Cephalometry: From Basics to 3-D Imaging" (Jacobson, A & Jacobson R. Radiographic Cephalometry: From Basics to 3-D Imaging, 2nd edition. Chicago, IL: Quintessence Publishing. 2006, pages 99-111.).
Custom Analysis - In addition to the standard analysis choices built into SmartCeph, you can use the Custom Analysis feature to create your own analysis templates, or Ortho2 can, at your request, provide you a custom analysis for a fee. A custom analysis can include landmarks, planes, or variables from standard SmartCeph analyses, or your own alternate sources. In the case of custom analyses, the customer verifies the accuracy of the implementation of the analysis.
You analysis options include selecting the default analysis to use for tracing, whether to include the tracing on the analysis report, and customizing the structures to use in the selected analysis.
 Open Analysis Options Window - Select the
  Options icon from the Analysis section of the SmartCeph Main ribbon bar.
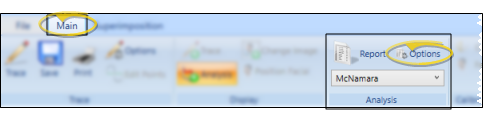
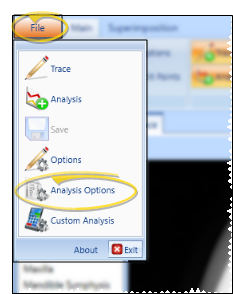
Alternately, you can select the Analysis Options icon from the File ribbon bar.
-
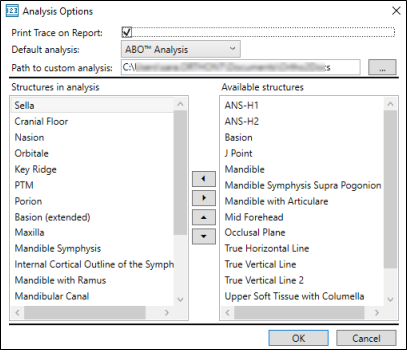
Choose Your Analysis Settings - Use the Analysis Options window to select your default analysis. You can also choose individual structures to include in your tracings, and choose whether to include a graphic of the tracing on your analysis reports.
Print Trace on Report - Use the Print Trace on Report analysis option to select whether to include a graphic of the trace and analysis at the bottom of the Analysis report.
Path to Custom Analysis - If you have created or installed one or more custom analysis, enter the file location in the Path to Custom Analysis field so they will be included in the list.
Default Analysis - Use the Default Analysis drop down list to select the analysis to use when you start a tracing.
ABO Case Submission Integration - To be able to use the full set of ABO-required structures for the ABO Case Submission integration in Edge Imaging, you must select the ABO Analysis as your analysis.
Structures - The structures required for the selected default analysis appear in
the Structures in Analysis column, on the left side of the window. Other structures that SmartCeph supports, but are not required
for the given analysis, appear in the Available Structures column on the right. You can use the [<] and [>] arrows to move structures from one column to the other, and the [ ^ ] and [v ] arrows to rearrange the selected structures. When you trace a ceph, you will be prompted to place the selected structures in order, from the top down.
Default Structures Reset - When you first choose a Default Analysis, SmartCeph will reset the Selected Structures to only those required for that analysis. If you want to permanently change the default structures for an analysis, you will need to create a custom analysis with those structures. See "Custom Analysis" for details about this option.
Superimposition Requirement - In order to align the ceph on the lateral facial photo for superimposition, it is necessary to include Upper Soft Tissue and Lower Soft Tissue in your selected structures.
Mandible Replacements - If the selected analysis requires Mandible , you can remove Mandible from the Select
Structures column and replace it with either Mandible with Articulare or Mandible with Ramus. If the
selected analysis requires Mandible Symphysis, you can replace it with Mandible Symphysis Supra Pogonion.
-
Save Your Changes - Click Ok to save the changes you have made and close the editing window.
Structure Components - The default structures lists and landmarks have been carefully crafted
and reviewed for accuracy. Each
landmark includes several components used to identify it. It is important that you do not change or remove these files from your computer.
Name - This is the name that appears in the structures list.
Sound - This is a .WAV file that speaks the name of the landmark as SmartCeph
prompts you to plot that point. (You hear the name only if you have enabled audio prompts. See "Trace Options" for details.)
Picture - This is a .png file that displays a graphical representation of the current landmark in the workspace window as you trace an image.
Description - This is the technical terminology for the landmark that is displayed just under the picture in the workspace window above.