Main ribbon bar >  Analysis.
Display the Analysis to review and evaluate your traced cephs.
Main ribbon bar > Analysis.
Analysis on image - When the Analysis tool is enabled, the numerical values of the traced points of your ceph appear on the image.
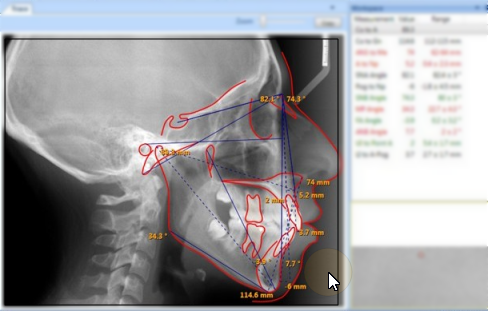
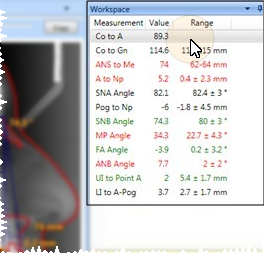
Analysis text - When the Analysis tool is enabled, the results appear in the Workspace window. Category groups and color-coding make it easy to read: Black indicates the result is within the 1st standard deviation range, green is within the 2nd standard deviation, red is greater than the 2nd standard deviation.
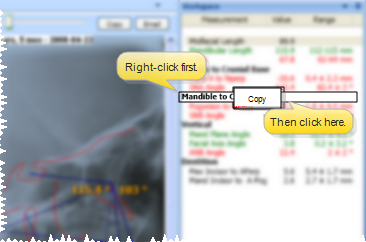
Copy workspace text - From the workspace window, right-click and select Copy to place the analysis details in your clipboard. You may then paste the text in another application, such as the patient's treatment plan.
Display a different analysis type - Select another type from the Analysis section of the ribbon bar. If you select an analysis for which you have not placed all the necessary points, a message will inform you. You can then change your Analysis Options to add the necessary structures to your Structures list, and use the Trace tool to place those structures. (If you have custom analysis templates that are not listed, be sure the Path to Custom Analysis field of your Analysis Options is correct.)
Recalibration option - If your analysis does not seem to be correct, you might want to recalibrate and re-trace the ceph. See "Recalibrate Images" for details.
 │
│  │
│  │
│ 
Ortho2.com │1107 Buckeye Avenue │ Ames, Iowa 50010 │ Sales: (800) 678-4644 │ Support: (800) 346-4504 │ Contact Us
Chat with Software Support │Chat with Network Engineering │ Chat with New Customer Care
Remote Support │Email Support │ Online Help Ver. 12/18/2015


